Objective
To document the methodology for Aquifer Mapping - especially when undertaken in an urban context and with citizen participation.
The main document is generic in nature and does not refer to any specific maps or organisations with respect to the Bangalore Aquifer Mapping project. Specific information with respect to the project is maintained in the Appendix.
The methodology involves three tracks - Hydrogeological, Social and Platform. For each of the tracks there are expected outputs and the methodology to be followed to achieve the expected outputs. The points and junctures where these three tracks need to work together is also highlighted.
The issues with undertaking an aquifer mapping project of this nature (urban and participatory) and the innovations that might be required are also listed.
Hydrogeological Track
Expected outputs of the hydrogeological track- A Ground Water Map which maps the extent of the aquifer boundaries.
- Information on the availability of water in the Aquifer - Storativity and Transmissivity.
- Description of suitable ground water management practices within and outside of the Aquifer boundary, eg: How and where to do ground water recharge. What is the appropriate way and quantity of extraction.
Methodology for the Hydrogeological Track
- Identification of the data and the frequency at which this is to be collected:
- Lakes: Name, location, area, storage capacity, inlet-outlet location, recharge-discharge to lake
- Borewells: Name, Code, depth, water struck at while drilling, periodic water levels, periodic water quality, hydrogeological log
- Open Wells: Name, code, location, depth, diameter, periodic water level, periodic water quality
- Geology: Geological exposures at quarries, road cuttings, digouts for apartment foundations etc.
- Water Demand: Demography based water use, water use patterns, surface water and groundwater
- Sewage Treatment : STP locations, Outlets through STPs
-
Identification of the process which will be used to interpret this data such that the “Expected Outputs” can be answered
The primary aim of this track is to generate a better scientific understanding of the groundwater resource at an aquifer level. An attempt to create an aquifer map will be made based on integrating and overlaying data and information mentioned above. The study area being an urban setting is thus unlikely to have good geological exposures. Thus hydrogeological data from borewells collected through narratives forms an important process in generating data.
Geology related information collected through narratives/actual measurements during drilling of a borewell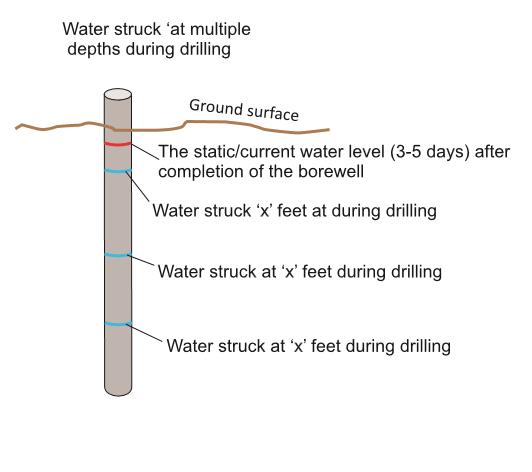
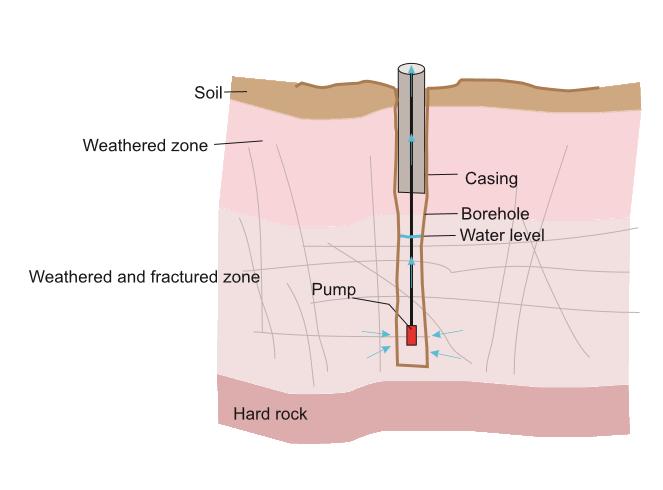
Data will also be gathered from construction sites and quarries where geology beneath is exposed easily. The narrative of borewells will also record zones/levels at which water was struck while drilling.
A combination of geological information derived from available maps, narratives, zones where water was struck while drilling, depth of borewells, periodic water level fluctuation, average static water level and to some extend water quality will help generate an aquifer map.
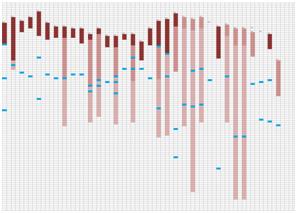
Initially geological information will be fed in an excel sheet to generate certain 2 dimensional hydrogeological sections such as shown below:
Hydrogeological data collected through narratives is represented in excel and then interpreted as individual borewell logs to create a conceptual layout of the hydrogeology and aquifer system.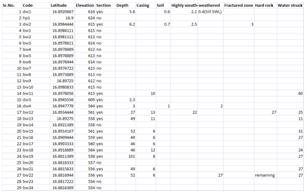
Drawing upon inferences from these certain maps/layers depicting primary aquifer information will be created using softwares like Surfer which inturn could be overlayed onto the platform. The same hydrogeological information along with information related to water quality would be used to create outputs in 3-Dimensions such as follows to get a better understanding for visualisation:
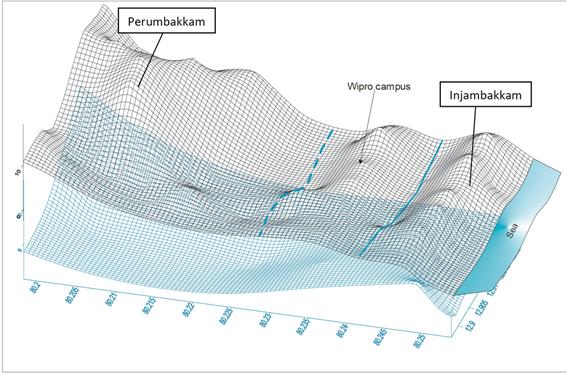
A combination of different types of dataset from that being collected will be overlaid in order to draw inferences regarding aquifer level information.
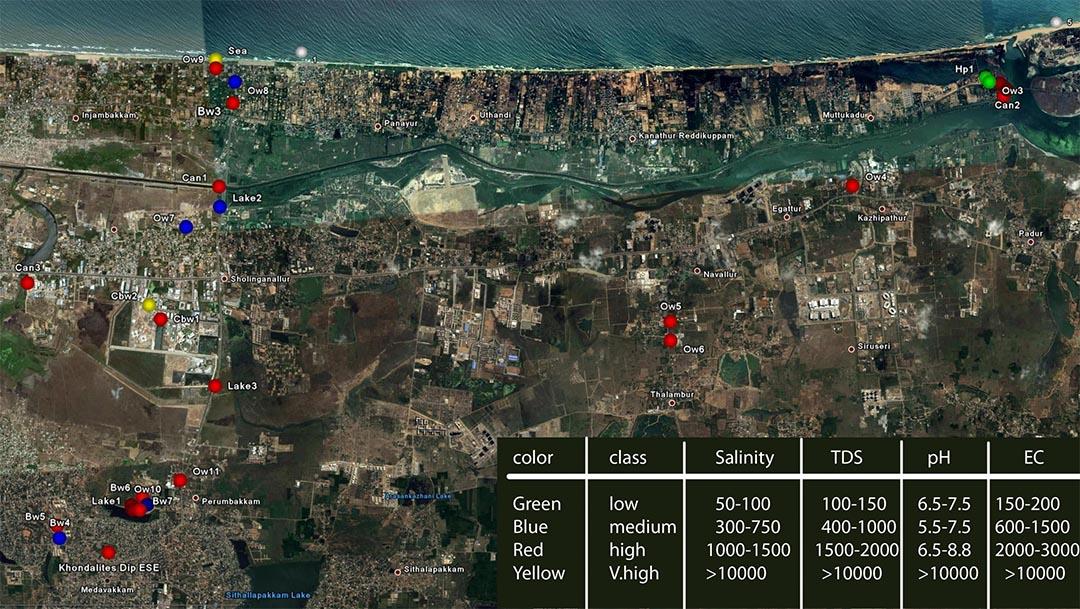
Overlay of water quality information from borewells on google mapsCo-relating hydrogeological data over demand data would be a crucial aspect in the project. The supply for a demand may not necessarily be sourced from the same area where demand is generated. The aquifer boundaries too may or may not be in line with the demand area.
- Identification of innovations necessary to interpret the data. eg. since the data is being collected in dynamic circumstances - borewells being pumped, rapidly changing demand and supply. The regular interpretation of the data to arrive at the aquifer map may not necessarily work out as expected. This will require an identification of the assumptions that are implicitly made during data collection and imaginative interpretation of conversations.
- As more and more data on all fronts starts to flow in the process and boundaries of aquifers would get continuously refined.
Social Track
Expected output of the Social track
- Data necessary for the hydrogeological track is collected from citizens.
- Interpreted results from the hydrogeological track is communicated back to the citizens.
- Change water management practices of people/institutions.
Methodology for the Social Track
-
Identify the critical people and institutions to provide this data (citizen groups) to:
- RWA , schools , businesses
- Service providers (tanker operators, stp providers, borewell diggers, hydrofrac experts)
- Other researchers of water and ground water
- Government agencies
- Map the data that is expected by the hydrogeological track to the various groups (from 1) which can provide the data.
- Create clear communication packages to educate people about the data that is going to be collected. - eg. a picture of borewell showing the depth of the casing, the depth of digging, the static water level. This is to enable groups to provide the requisite answers and also communicate to them as to how this data be measured . The communication package is dependent on the data that each group has to contribute is different for the different groups.
- Design processes to excite people to contribute data - eg. RWH Mela, Incentives, Regular sessions with a group of employees.
- Implement mechanism/process to collect/collate this data (eg. - phone calls, software platform for collecting this data and standardized spreadsheets to record this data).
- Create a communication process and package to take the interpreted data and research findings back to the people.
- Monitor how the changes are being implemented on ground. Identify Services or conditions (advocacy/policy changes) to enable on ground implementation. This monitoring process can also be participatory since the data comes from the citizens.
Platform Track
Expected output of the Platform Track
-
Platform for data collection and collation, with capability to visualise/display/represent the data in ways which are useful for:
- Hydrogeological interpretation
- Citizen understanding
- Enable communication of hydrogeological interpretation and good management practices.
- Evolves into a place where the city can share its knowledge and experiences around ground water.
Methodology for the Platform Track
- Discuss the project scope with ecosystem partners including Wipro, Biome and Acwadam.
- Identify the interests of the community and other stakeholders.
- Analyse requirements based on the above inputs.
- Arrive at a basic design.
-
Develop an initial web-based map interface and prototype that has the following components:
- Rastor/Vector layers
- Mechanism for tile server
- MIS (Management Information System) server interface that works with the GIS (Geographic Information System)
-
Enable participation of community and other stakeholders via:
- Data collection
- Data verification
- Data integrity
- Visualization
- Transparent and informed decision-making
- Expand user-base and iteratively invite stakeholders to provide data.
- Build a mechanism to communicate and disseminate information.
- Add analytical capabilities based on inputs from partners.
Note on software
Open Source Software (OSS) has been used for this project. This is because OSS consists of proven technology that is flexible, inexpensive and does not require lock-in to a vendor’s proprietary software. Further, OSS software can be customized for the project’s requirements. There are continual enhancements made by the OSS community which ensures that the technology is kept up-to-date. OSS is also better in terms of adhering to open standards compared to proprietary software, making inter-operability easier.
 |
 |
 |
 |
